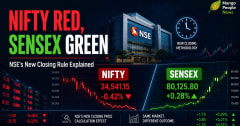
Why the Nifty Can Hit a New High While Your Portfolio Bleeds

You open the news app. The headline says: "Nifty scales new peak." You open your demat app a minute later, most of the stock in your portfolio is red.
For a moment, you wonder if something is broken. Nothing is broken. You have just discovered the gap between index momentum and market breadth — two very different things that happen to share one number: the Nifty.
This gap frustrates almost every retail investor at some point. Once you understand why it happens, the Nifty headline stops feeling like a personal insult.
The Heavyweight Illusion
Picture a class of 50 students. The "class score" isn't a simple average. It's weighted — the five toppers count for far more than the other 45 combined.
If those five toppers each score 100 out of 100, the class score climbs. It climbs even if the other 35 students fail their exams. On paper, "the class did well." In reality, most of the class struggled.
The Nifty 50 works on the same principle, called free-float market-cap weighting. A company's weight in the index depends on its size — specifically, the value of its shares that are freely available for public trading. The bigger the company, the more it moves the index when its price moves. Here's how skewed that weighting actually is, as of September 2026:
Reliance Industries alone carries roughly 9% weight.
Bharti Airtel, HDFC Bank, ICICI Bank, and SBI together add another 22%.
The top 10 stocks combined account for roughly 53–55% of the entire Nifty 50's movement.
Banking and financial services stocks alone make up nearly 34–38% of the index.
That means a good trading day for five or six large banks and Reliance can push the Nifty to a new high — even while capital goods, auto ancillaries, and hundreds of smaller companies are quietly falling. The index isn't lying. It's just measuring something narrower than "the market."
A Real Example: The Narrow Rally
This isn't a hypothetical. In August 2026, the Nifty Midcap 100 touched a fresh 52-week high. But data at the time showed that 46 midcap stocks were still sitting 20% to 110% below their own 52-week highs, and roughly 40% of midcap constituents were trading below their long-term 200-day average price — a common gauge of whether a stock is in a sustained uptrend.
In plain terms: the midcap "index" looked strong, but fewer than half the stocks inside it were actually strong. A handful of winners were doing the heavy lifting for the rest.
The same pattern plays out constantly with the Nifty 50 itself. Institutional money — mutual funds, foreign investors, insurance companies — often turns defensive during uncertain times. It crowds into a small set of "safe" large caps: IT majors, private banks, FMCG giants. When that happens, the Nifty trends upward even as mid-caps, small-caps, and capital goods stocks undergo a sharp correction underneath the surface.
Interestingly, the reverse can happen too. For much of 2026, the Nifty 50 itself has been roughly flat to slightly down for the year, while the Nifty Midcap 100 and Nifty Smallcap 100 have gained meaningfully more. The lesson cuts both ways: the headline index — up or down — often tells you what a handful of giants are doing, not what your own portfolio of smaller, more diversified holdings is doing.
The Metric That Actually Tells You What's Happening: Advance-Decline Ratio
If the Nifty headline can mislead you, what should you check instead? The Advance-Decline (A/D) Ratio, published daily by the National Stock Exchange (NSE).
It's a simple idea: on any trading day, count how many stocks closed higher (advances) and how many closed lower (declines). Divide advances by declines.
A/D ratio above 1 → more stocks are rising than falling. The rally is broad-based. Capital is flowing across the market, not just into a few names.
A/D ratio below 1 → more stocks are falling than rising, even if the index itself is green. This signals a narrow, top-heavy rally — good for the five toppers, bad for the rest of the class.
For context on how extreme this reading can get: in September 2024, the A/D ratio on the NSE fell to around 0.1, with only 183 stocks advancing against 1,658 declining in a single month — a breadth collapse as severe as anything seen since the 2008 financial crisis. The Nifty Midcap 100 dropped 14% that month and the Smallcap 100 fell 20%, even though large-cap technology stocks cushioned the headline index.
If you only read the Nifty headline, both scenarios look identical: "Nifty is up." The A/D ratio is what tells them apart.
What This Means for Your Portfolio
If you hold mutual funds, direct mid-cap or small-cap stocks, or a diversified portfolio, don't panic simply because it's lagging the Nifty during a narrow rally. A few things are worth remembering:
The Nifty is not "the market." It's a 50-stock, heavily weighted snapshot dominated by banking and a handful of conglomerates. Your portfolio, especially if it includes mid-caps and small-caps, is exposed to a much wider — and differently behaved — set of companies.
Broad corrections often clear out speculative excess. When 1,300 stocks are declining while 700 rise, much of that decline is smaller, overvalued, or weak-fundamental companies losing the froth built up during earlier rallies. Painful in the short term, healthy in the long term.
Benchmark yourself correctly. If your fund is a flexi-cap or multi-cap fund, don't compare its returns to the Nifty 50. Compare it to a flexi-cap or multi-cap index instead. Comparing a diversified fund to a top-heavy, bank-dominated index will almost always create a false sense of underperformance.
Keep your asset allocation steady. The point of diversification across market caps is precisely to avoid being fully exposed to whichever handful of stocks happens to be driving the headline number this month. Reacting to every Nifty-portfolio mismatch by shuffling your allocation defeats that purpose.
The One-Line Takeaway
The Nifty tells you what five or six giants did today. The Advance-Decline ratio tells you what the market actually did today. Read both, and the gap between "Nifty at a new high" and "my portfolio in the red" stops being a mystery — it becomes a data point.

Nikunjj Jhawar is a Chartered Accountant (CA) and Chartered Financial Analyst (CFA) with nearly two decades of experience in the financial services industry. Having worked with global institutions such as HSBC and Credit Suisse in investment-related roles, he brings deep expertise in finance and markets. He is the Founder of mangopeoplenews.com, where he focuses on making complex topics in finance, markets and business accessible and relevant to everyday readers.